environmental change and the distribution of organisms
In this topic we looked at the relationships within communities of living organisms and the factors that affect the distribution of organisms in their natural environment. We learnt how you might go about measuring the distribution of organisms and even deviated into the world of maths for a bit. Finally we investigated how you might use biotic and abiotic indicators as a measure of environmental change.
|
Key words
Habitat - the place where an organism lives Community - all of the animals and plants that live in a particular habitat Environment - the surroundings of an organism. This includes biotic (living) things (eg., other animals) and abiotic (non-living) things (eg., temp, rain, etc) Distribution - where organisms are found and how widely spread out they are |
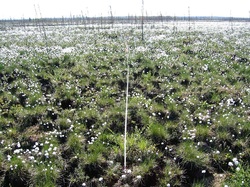
Availability of nutrients - important for plants. Remember how the venus fly trap and pitcher plants are adapted to survive in areas where nitrate levels are very low
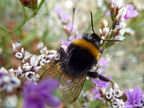
Availability of light - light limits photosynthesis. Bluebells come up early in the year in order to take advantage of the leaf-less trees in the woods. Also some animals have breeding cycles which are linked to light levels Availability of water - no water = no life Availability of O2 and CO2 - CO2 levels limit photosynthesis. O2 levels are important for water-dwelling organisms (eg, freshwater invertebrates) Biotic factors: Availability of nesting sites - animals need a safe shelter in order to successfully breed Presence of competitors/predators - a new predator or loss of an existing predator will have direct and indirect effects on the food web |
|
Quadrats
Ah, the humble quadrat! How everyone enjoyed being out in the fresh air, counting clover on the school field. Maybe not the most interesting of techniques to learn about but the quadrat is a fanstastically simple tool which can be used to measure the distribution of living things in their natural habitat. Remember, there are 2 main uses of quadrats:
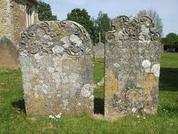
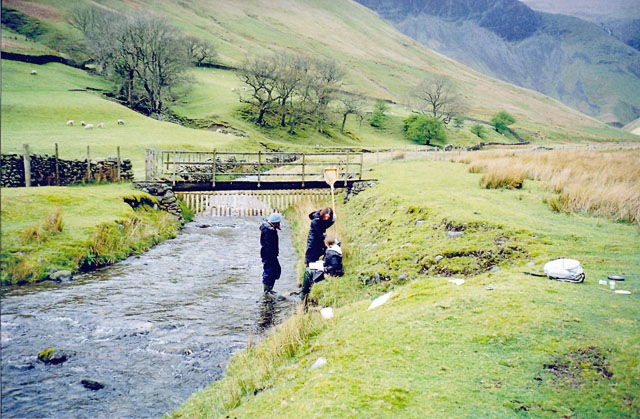
Remember that the reason biotic indicators such as lichens and freshwater invertebrates are so useful is because they are easy to count, measurements require little or no equipment, and they are extremely sensitive.
Non-living indicators that are used to measure environmental change include temperature, oxygen levels and rainfall. Know how each of these are measured, and the pros and cons of those methods! |
Some maths key words
Mean - the average of your numbers Median - the middle value of the range (remember to put the numbers in order before finding the median) Mode - the most frequently occuring value Range - the spread of values from the smallest to the largest Look at the GCSE Bitesize page for additional revision help. There's even a little quiz that you can do to check out your understanding
|
Here you can download revision notes that I have prepared for this topic!
| environmental_change_revision_notes.docx |
